Data Analysis and Visualization
Scientific simulation models generate a large amount of data, we integrate and create visualization tools capable of absorbing that amount of data and representing it in ways that facilitate its understanding.

Scientific simulation models generate a large amount of data, we integrate and create visualization tools capable of absorbing that amount of data and representing it in ways that facilitate its understanding.

Centralize all your maps in different tabs. Customize the data visualization in a few clicks.
Easily configure the desired indicators. See maps, forecasting and optimization methods in one click with our personalized server made for each client.
We analyze and interpret your data so you don’t have to worry about it. We’ll make some conclusions for you to understand the purpose of what you’re seeing. The more data, the better!
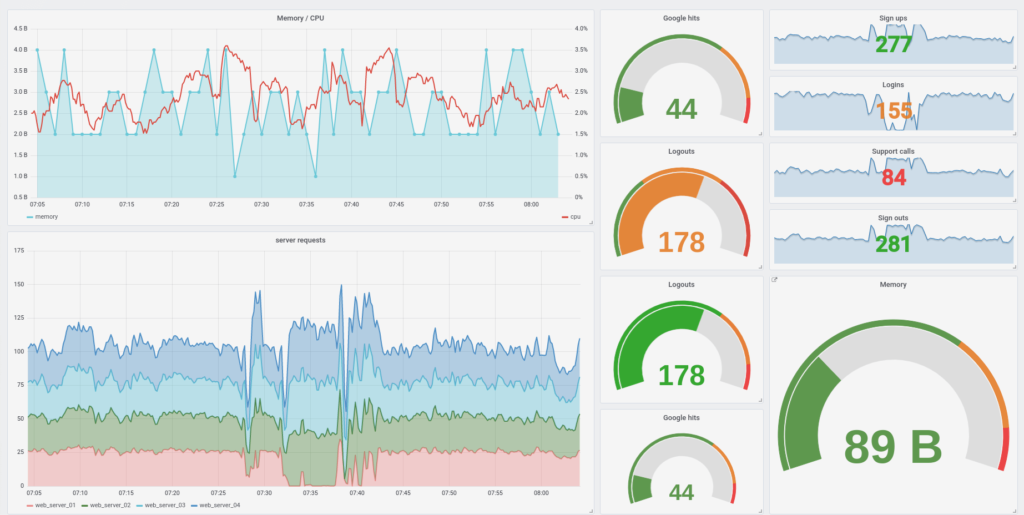
An example of how our service may present to you all the information needed. Customize everything you want to see and how you want to see it.
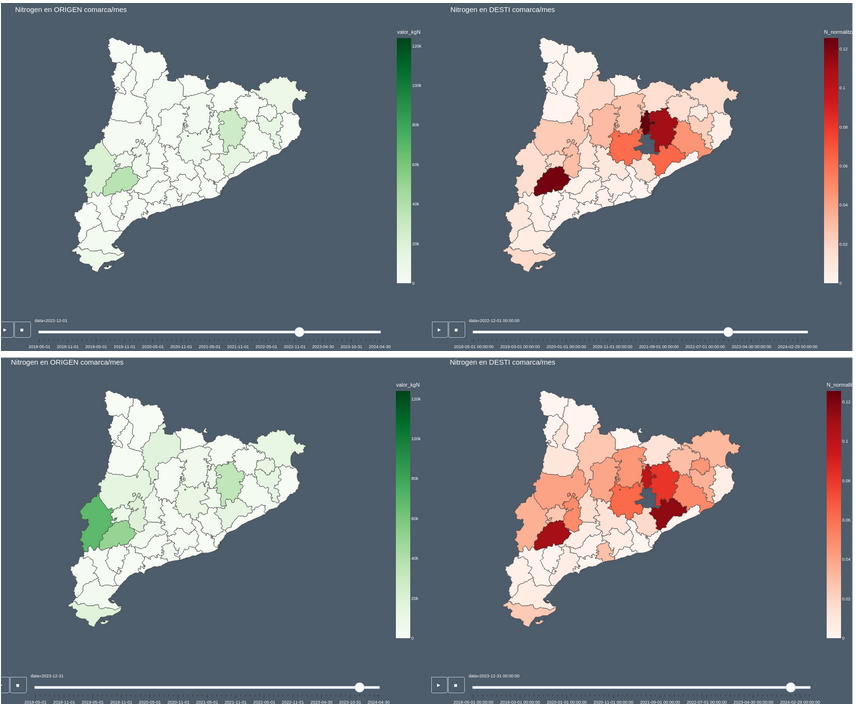
Big Data study of the distribution of slurry made by farmers throughout Catalonia, containing maps and predictions made with some of the best current models.
Result of our collaboration with the Universidad Politécnica de Barcelona (UPC) where we represent the movement of plastic particles at Barcelona’s coast.